Using the Inferno Testing Interface
Inferno provides a web-based interface for configuring and running tests included in a Test Kit.
Selecting a Test Suite (local installations)
For local installations, the initial screen will let use select a Test Suite to run. Test Kits may include multiple Test Suites, and even import Test Suites from other Test Kits.
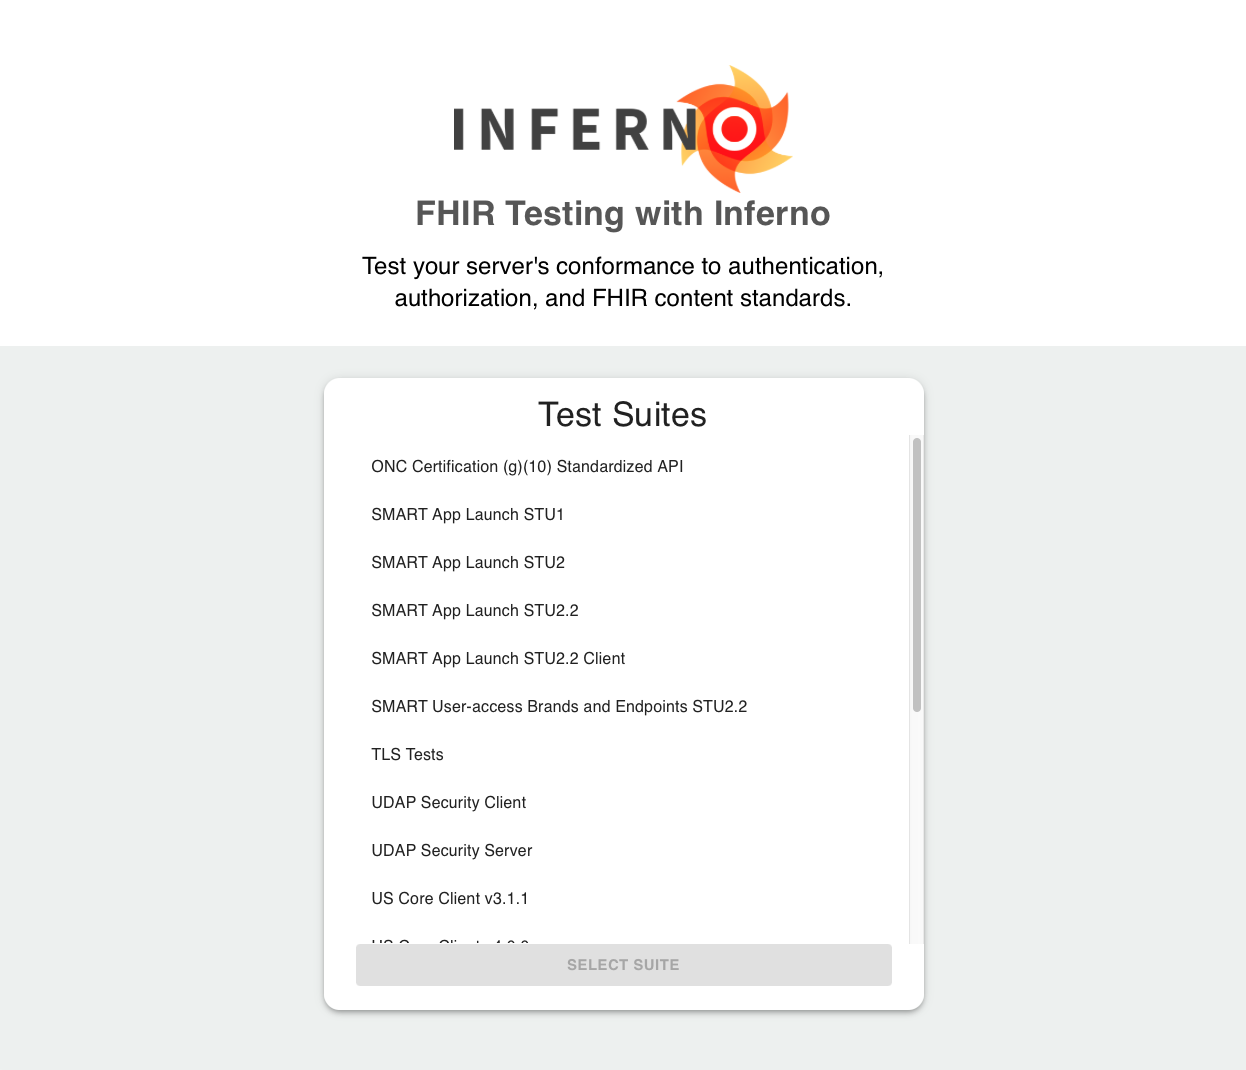
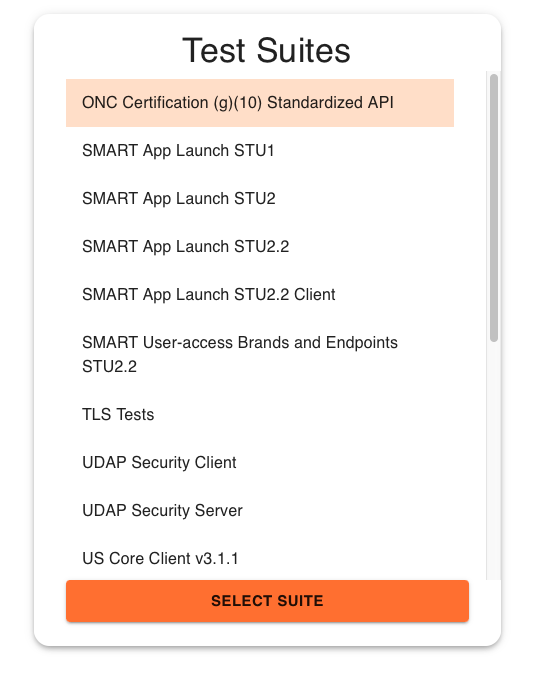
Select the name of the Test Suite you wish to run and click “Select Suite”.
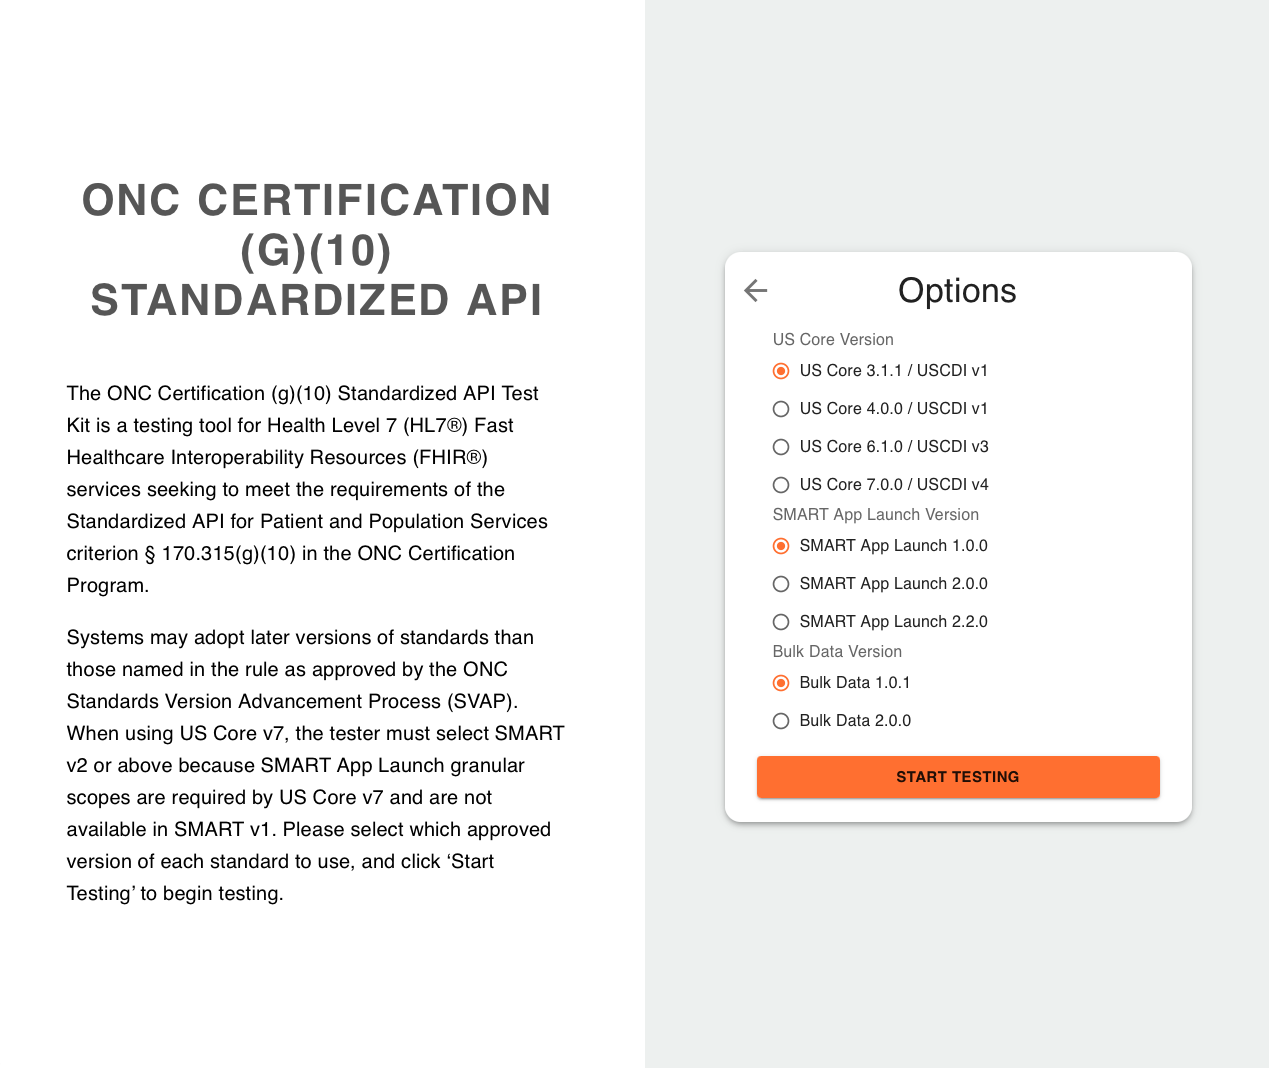
Some Test Suites may require selection of additional options. If so, you will see another dialog to select options for the Test Suite, with a Test Suite description. If you wish to select a different Test Suite, you may click on the back arrow in the options dialog. Select the desired options and click “Start Testing” to begin.
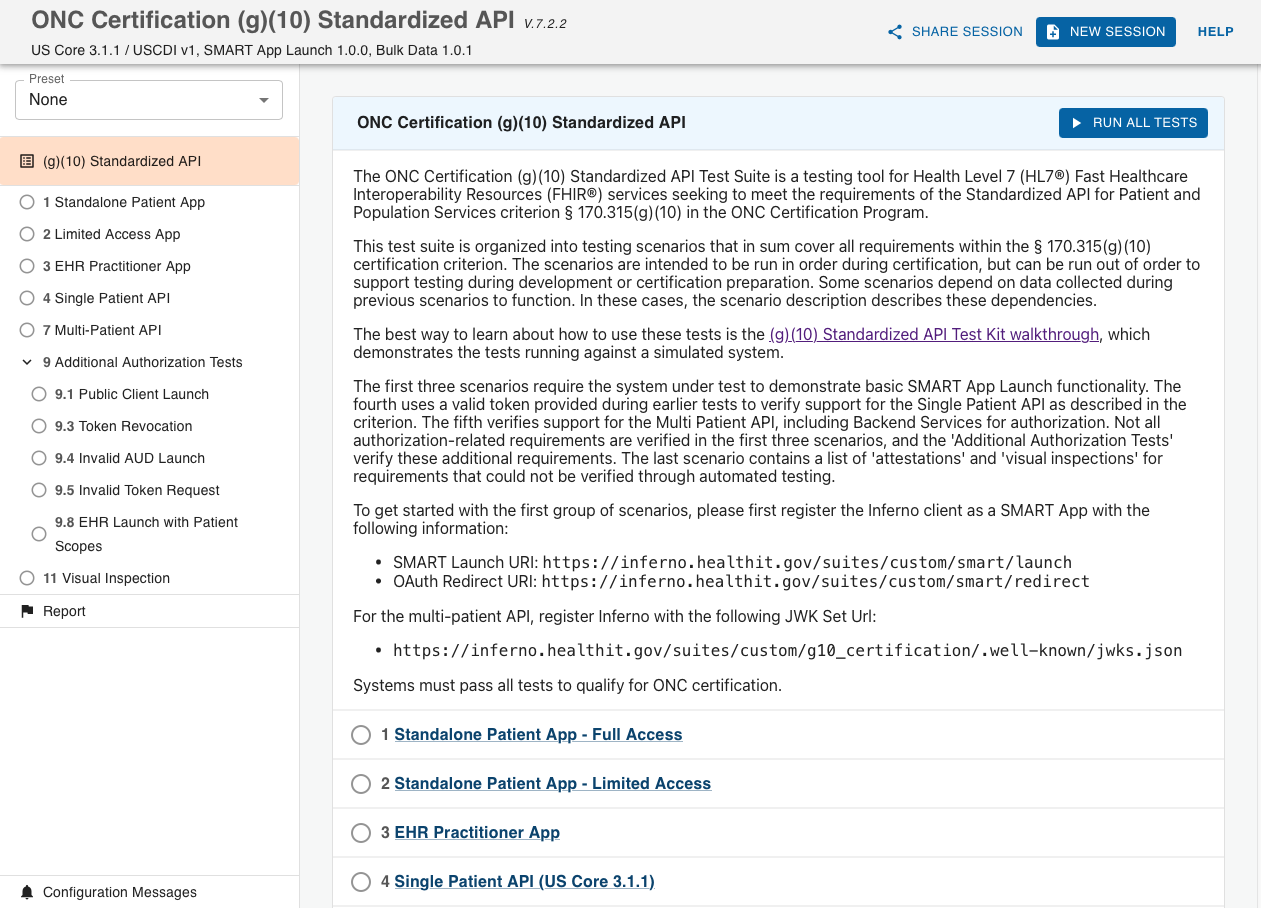
Main Test Interface
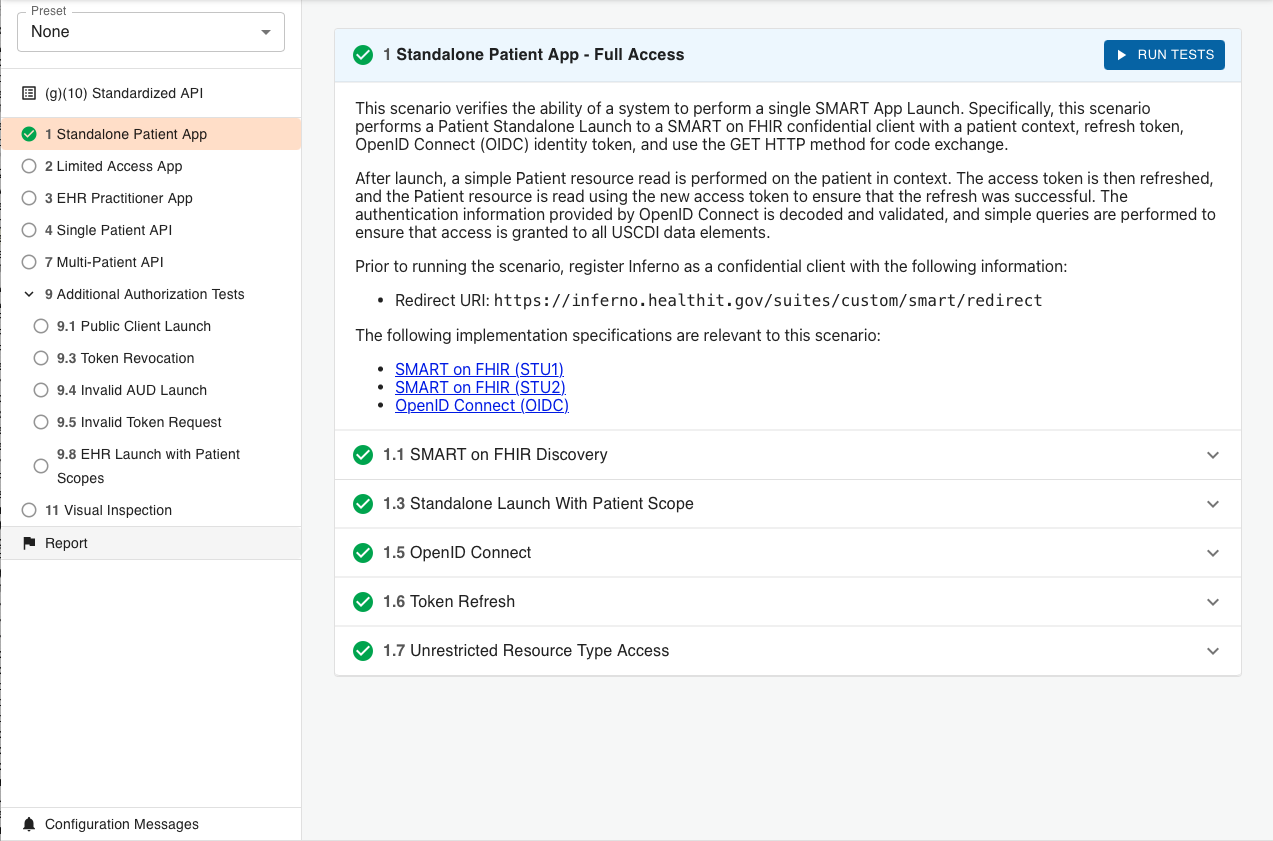
Once you have selected a Test Suite and Options, you are shown the main test interface. The two main parts of the page are a sidebar and main test area. The sidebar shows the various Test Groups, Report and Configuration links, and any Presets available for the Test Suite. This lets you navigate to and run specific Test Groups, without needing to run the entire Test Suite.
Main Test Area
The majority of the page shows the description and tests included in the selected Test Group. Clicking the expand arrow at the right of individual test groups lets you see individual tests, and view details of test execution.
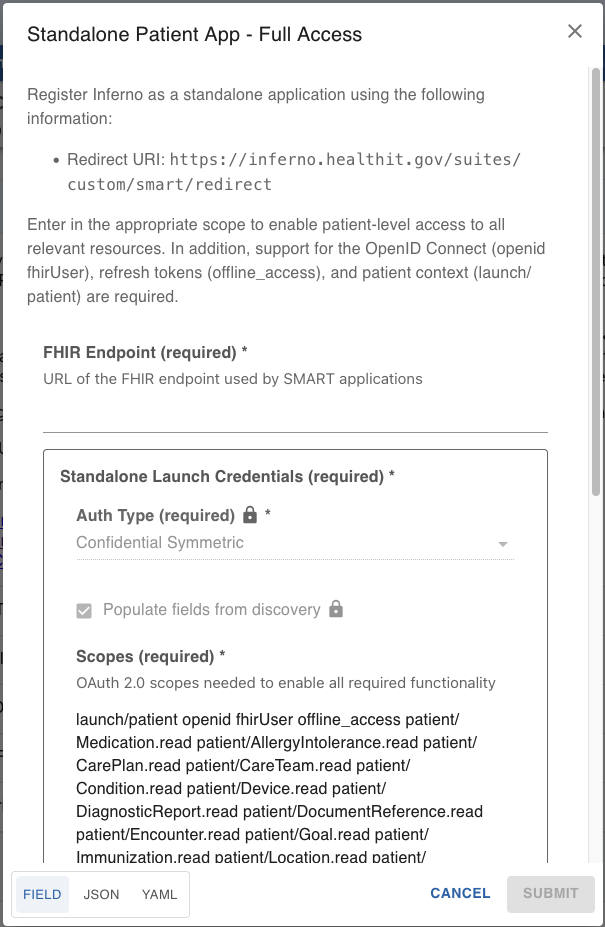
Test Groups usually require various user-defined inputs, such as URLs for server endpoints, authorization information and test options. Click the “Run Tests” button at the top right of the Test Group in the main test area to open the test options dialog.
When all required options have been entered, click on “Submit” to begin testing.
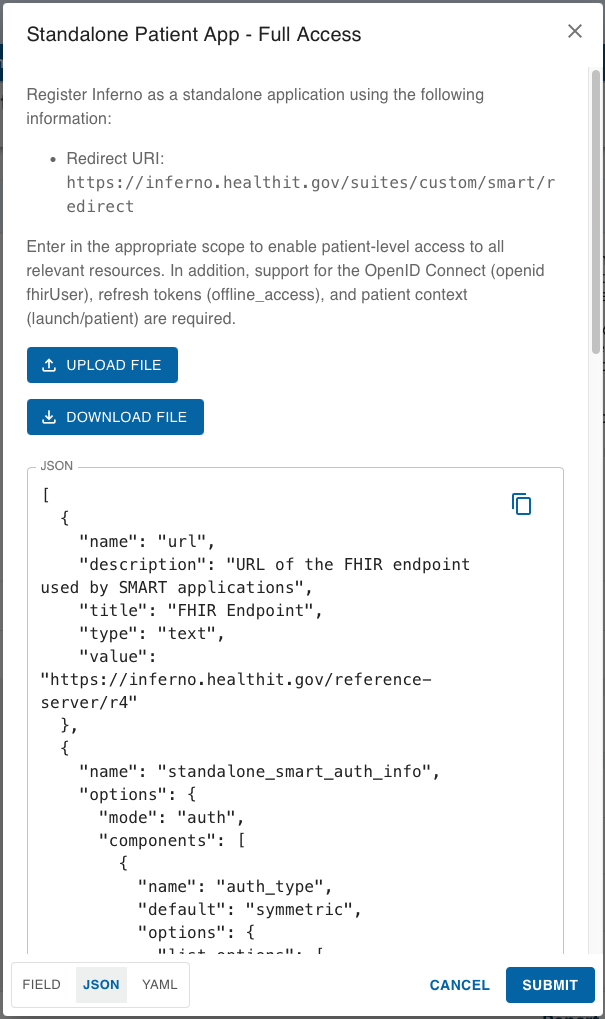
Required inputs for testing may also be provided in JSON or YAML formats. This is useful when you need to use the same set of inputs during testing, and avoids the need to manually enter values using the fielded form inputs.
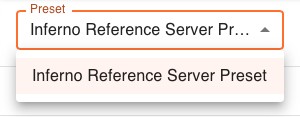
Test Suites may also provide sets of default input values to be used in testing. These sets are Input Presets and are listed in the Presets dropdown at the top of the sidebar. Selecting one of the available presets will automatically populate the specified fields in the Run Tests input dialog.
Running Tests
When tests are executed, the status of each test is shown in an icon to the left of the test. This indicates which tests have passed or failed.
The Help link at the top of the header will display a dialog with an icon legend. You may also view a tooltip explaining each icon by hovering over the icon.
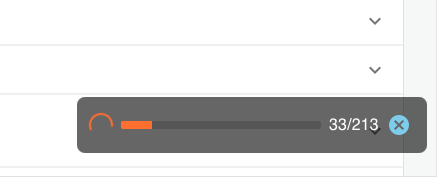
A progress indicator is shown during test execution, showing the number of the current test being executed and the total number of tests in the group to be run.
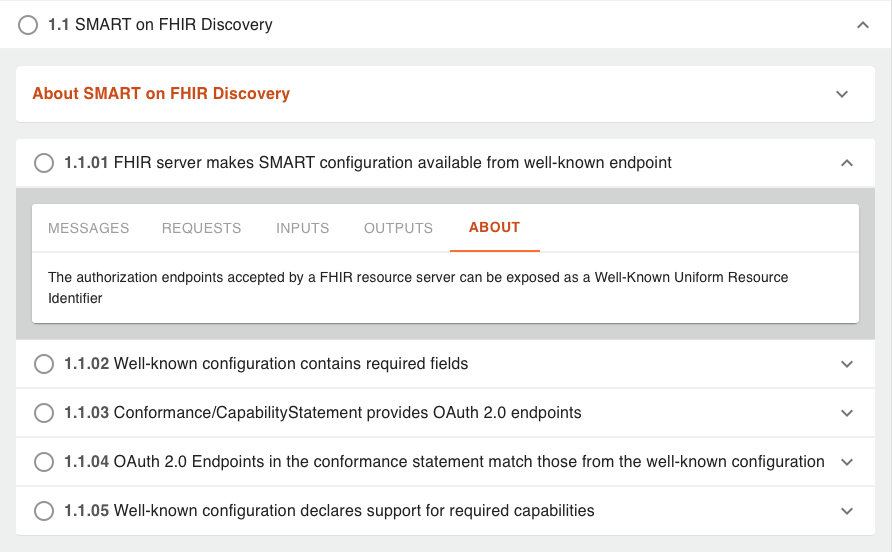
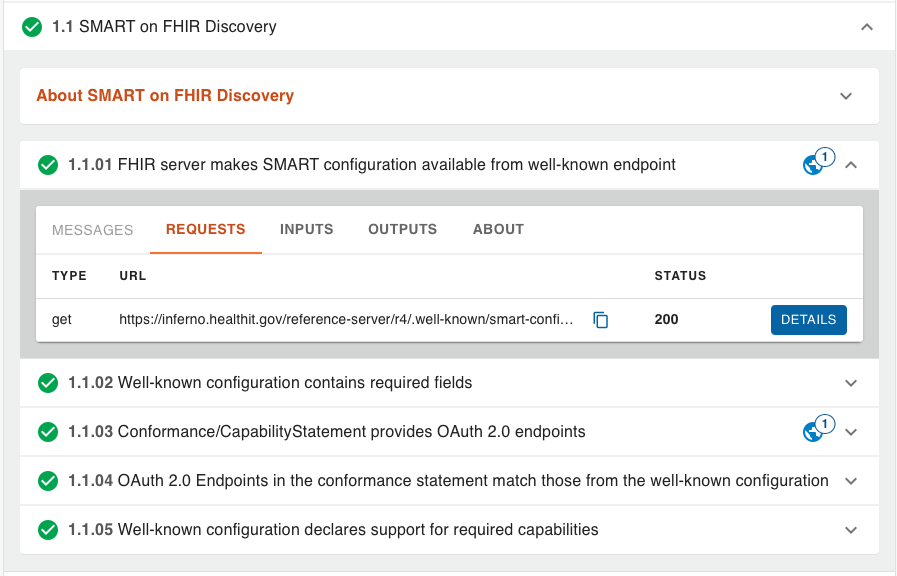
Viewing Test Details
Clicking on the expand arrow for test groups and individual tests will display additional details for each test. These include any messages, requests, inputs and outputs, and a description of each test.
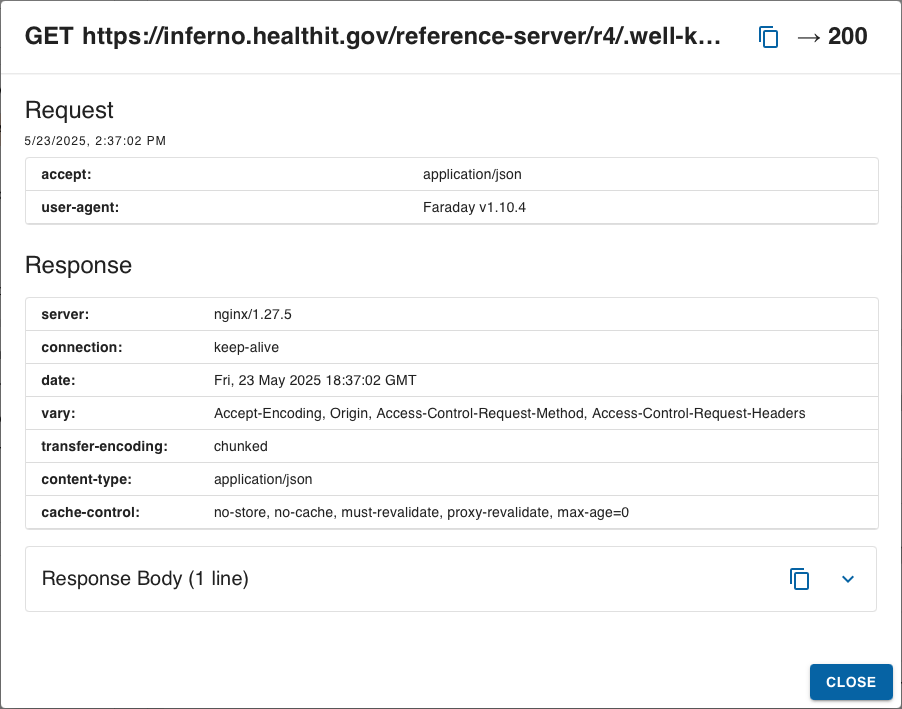
Additional details of each may be viewed by clicking the “Details” button, where another dialog lets you view the relevant details and values used in the test. This is very useful when debugging tests or inspecting details of specific servers or hosts being tested.
Icons displayed to the right of individual tests indicate if the test made requests or produced messages. Expand the details of the test to view the specifics about requests or messages.
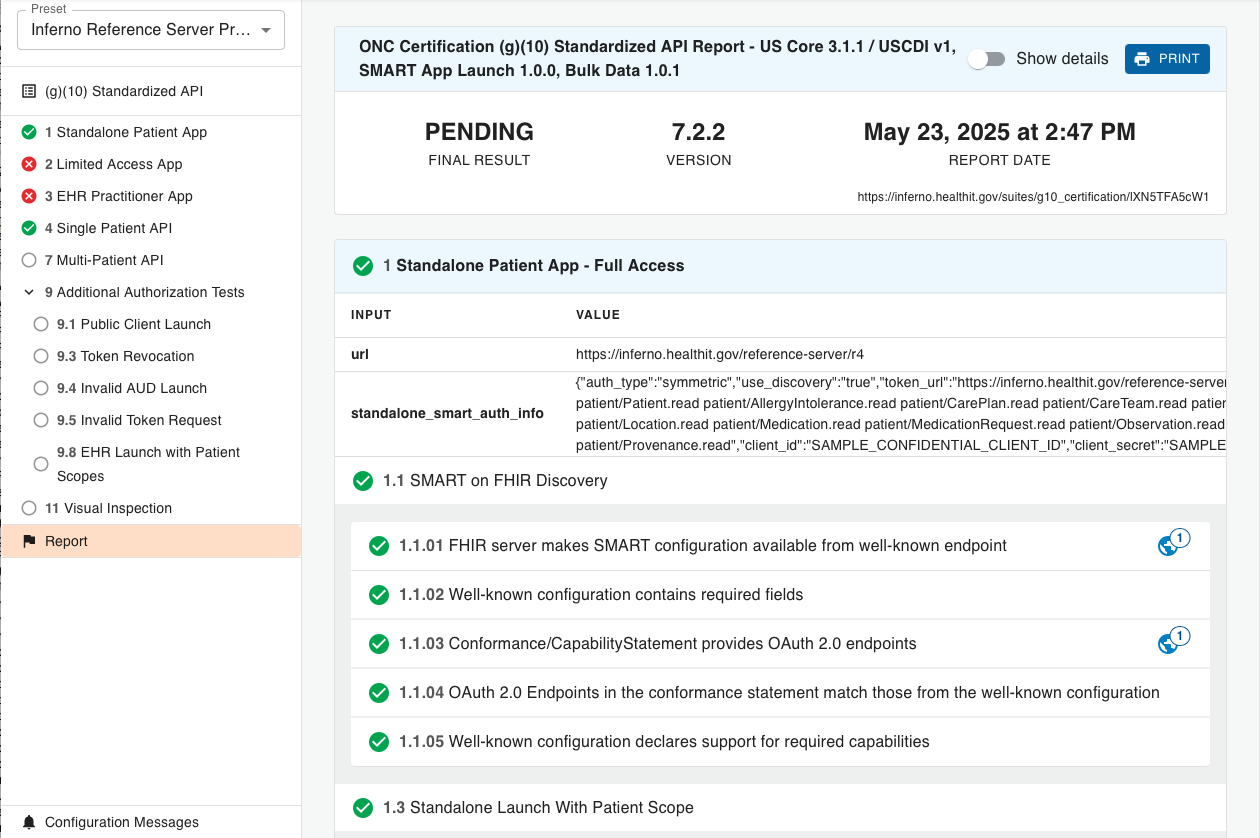
Testing Report
At any time, you may view a summary report of the test execution status. Clicking on “Report” in the sidebar will display a summary report page, with all tests in the Test Suite listed with the icon indicating the status of each.
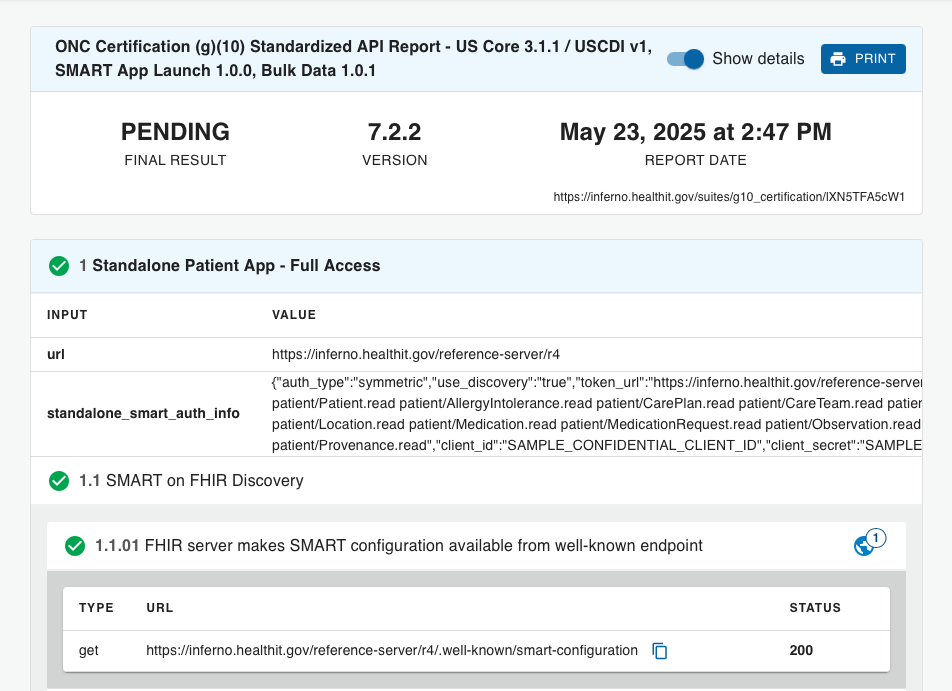
Clicking the “Show Details” toggle switch at the top of the report will expand those tests with Messages or Requests and include those details in the report.
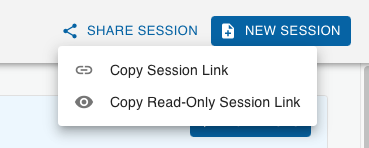
Shared Test Sessions
Individual test sessions may be shared using the “Share Session” button in the test area header. This menu provides a way to share a link to an existing test session (with users who have access to the instance of Inferno). A ‘read-only’ link may be sent to users, allowing them to view an existing test session but not to make changes to test inputs or to run the tests.
Viewing Verified Requirements
Inferno enables test developers to declare suite requirements and indicate which tests verify them. When test developers choose to do this, it provides testers with a detailed view of
- The discrete requirements that conformant systems are responsible for meeting and which of them are verified through the “Specification Requirements” page, and
- Which requirements the tests in the suite verify through “View Specification Requirements” links in test, group, and suite documentation panels.
Specification Requirements
Clicking on “Specification Requirements” in the sidebar will display a list of all the requirements that the test kit developers declared in the test suite. Each entry represents a discrete requirement that a relevant specification or regulation places on the tested system.
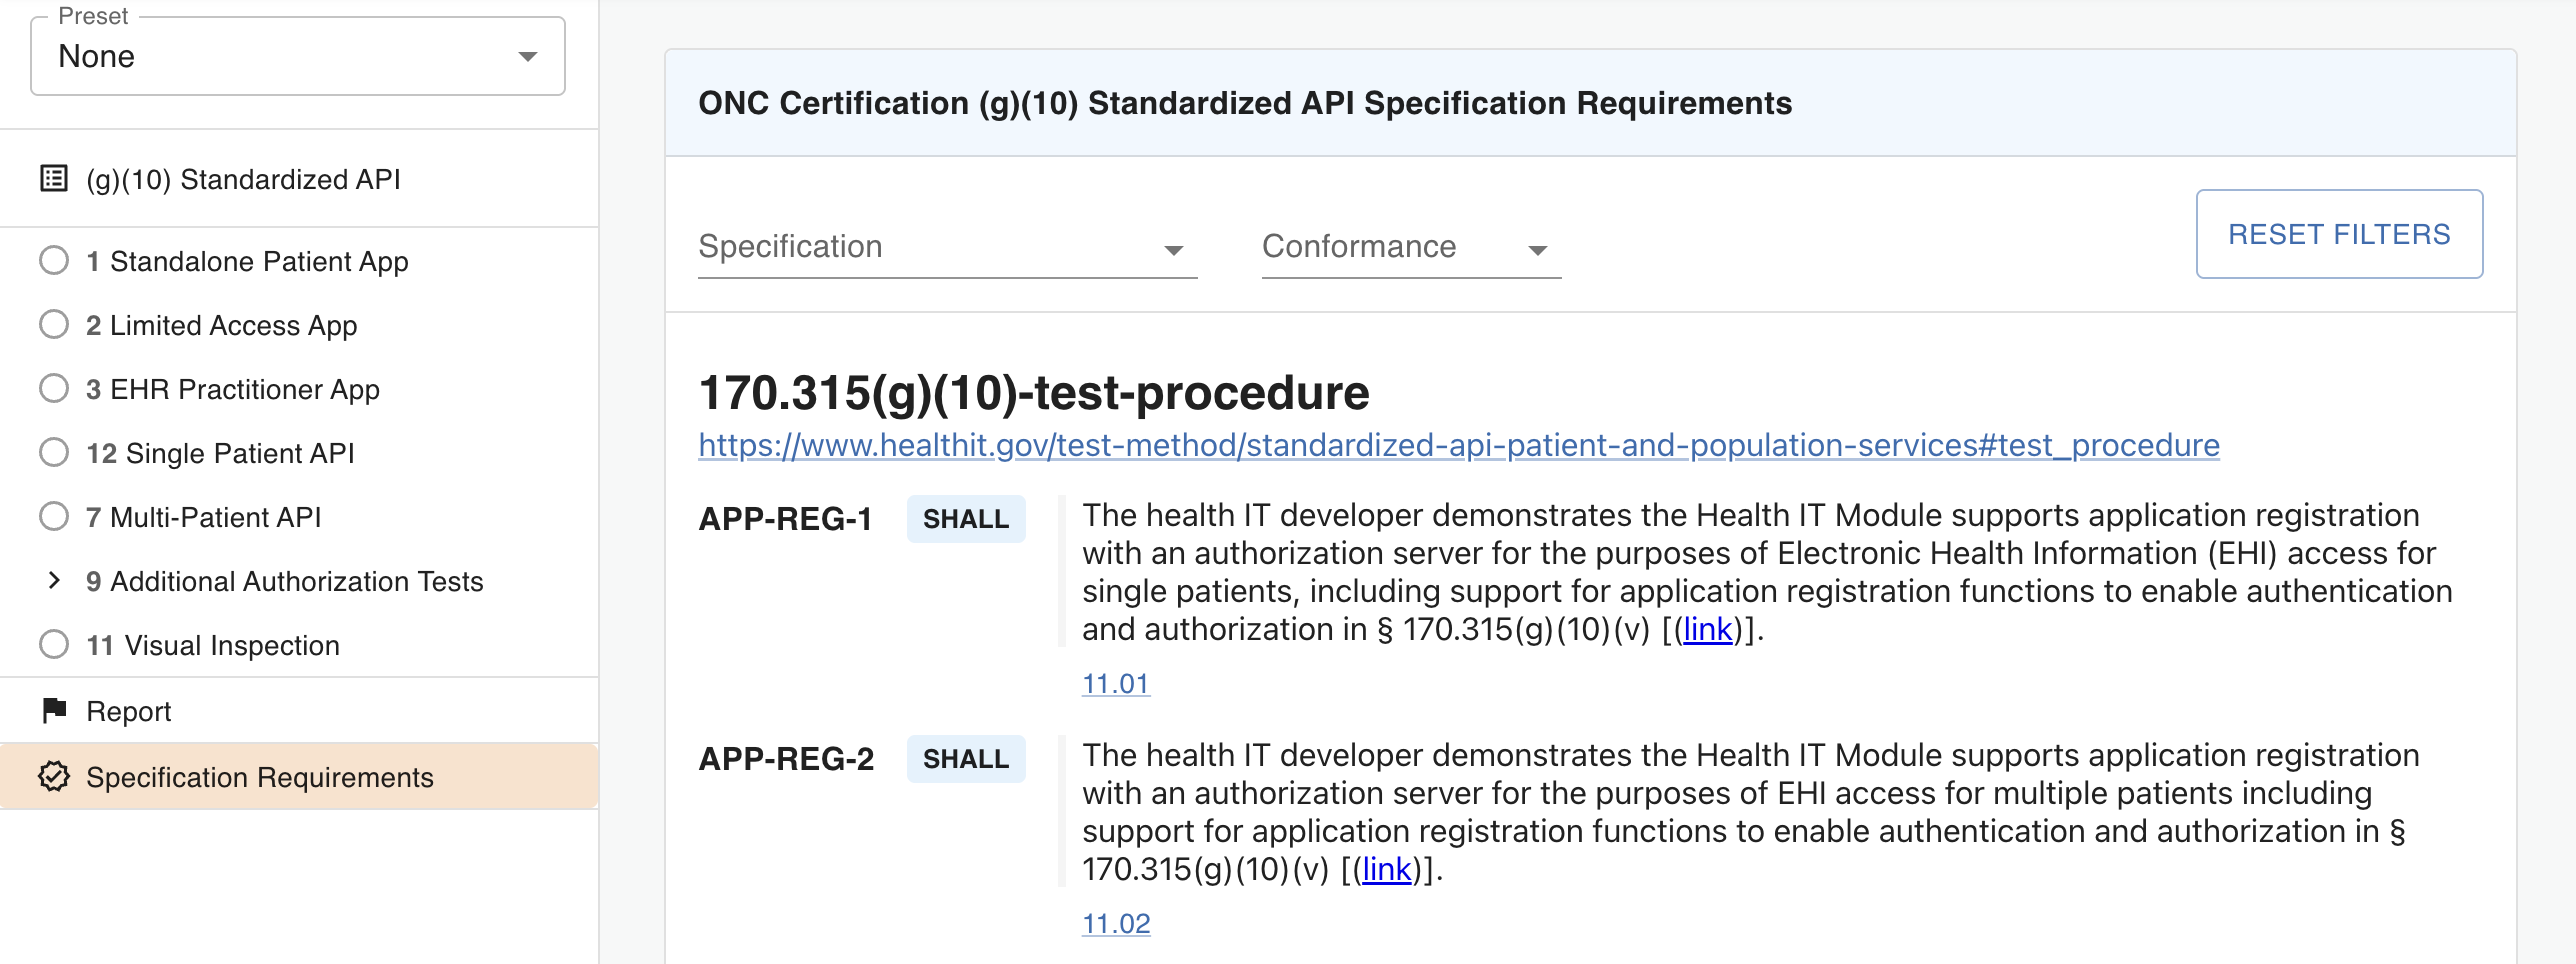
The requirements page groups requirements based on their definition location. The top of each group includes the requirement set identifier and a link that can be used to access the original source.

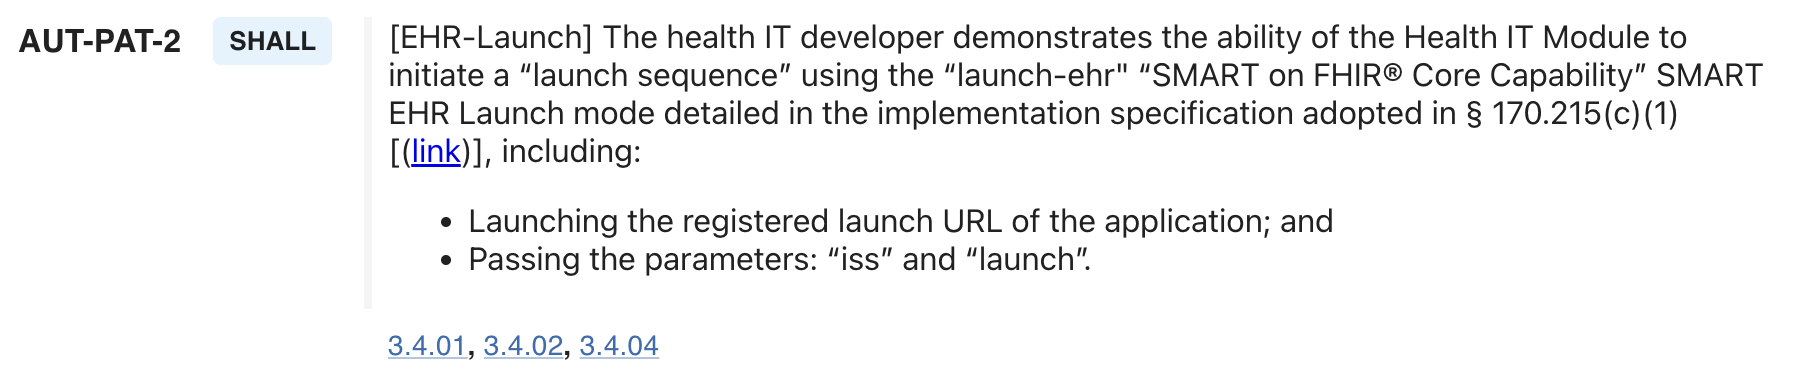
For each individual requirement, Inferno displays
- The requirement identifier. This will either be an identifier defined by the requirement source if one exists, or an identifier that was generated when the requirement was extracted.
- The strength of the requirement, expressed as a FHIR conformance verb, where “SHALL” means required, “SHOULD” means recommended, and “MAY” means optional.
- The requirement text. Note that the text will often have been edited for
clarity and to make them stand-alone by:
- Adding additional context, which is indicated by enclosing the added text in square brackets, e.g., “[this is context added to] a requirement”, and
- Removing unimportant details, which is indicated through an ellipsis (…), e.g., “Some superflous details were removed … from the middle of this requirement”.
- Where the requirement is verified, expressed as a list of links to the locations in the suite that verify the requirement, or “Not Tested” if the suite does not verify the requirement. If there are multiple tests listed, testers should assume that all linked tests must pass for the requirement to be considered met by the tested system.
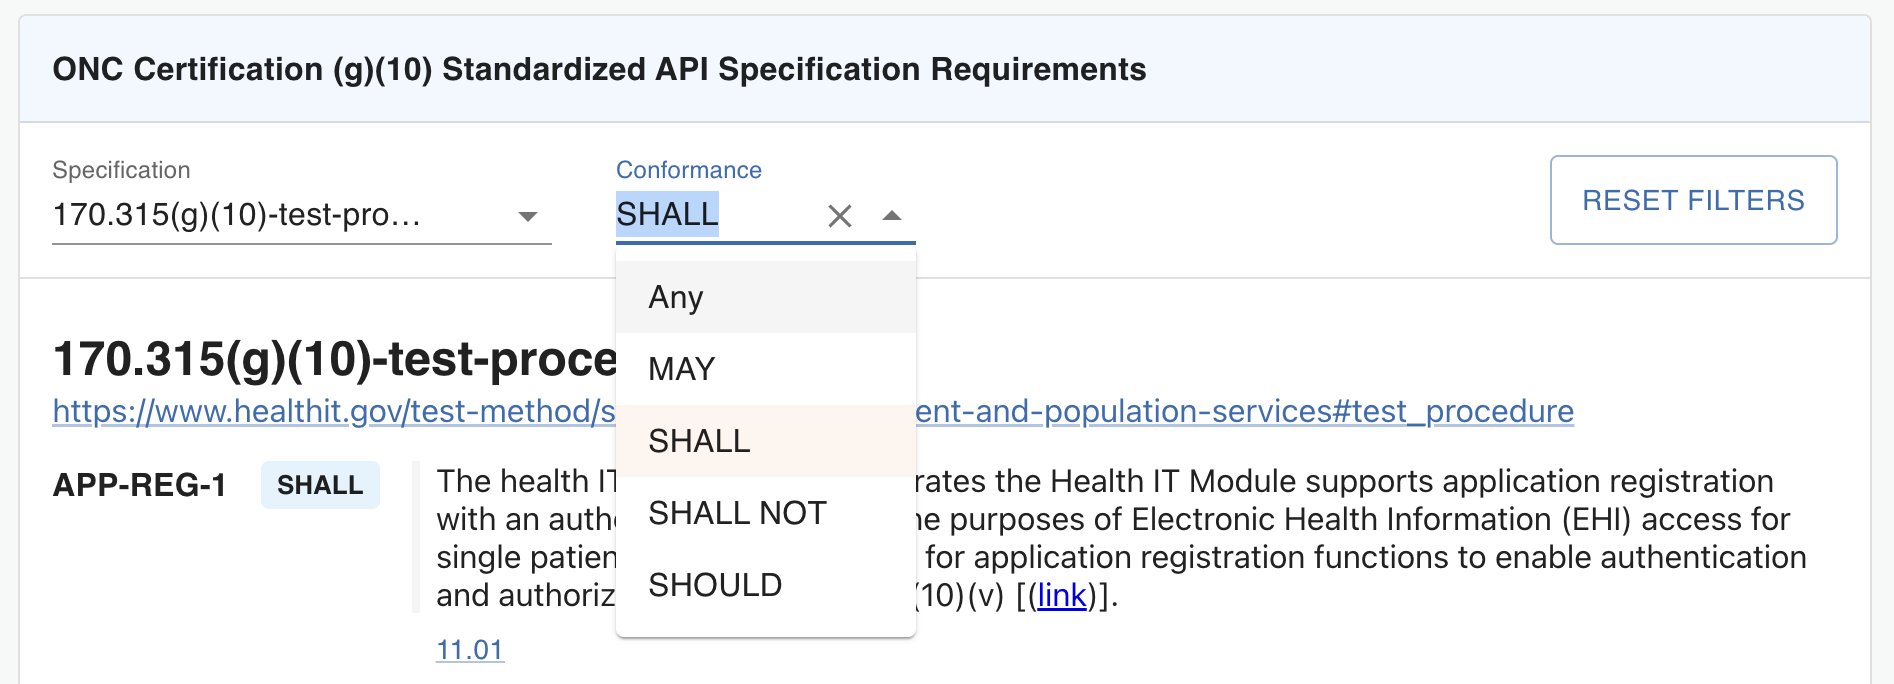
The page provides dropdowns that allow testers to filter the displayed requirements by the requirement set identifier or the conformance verb.
Test-specific Requirements Display
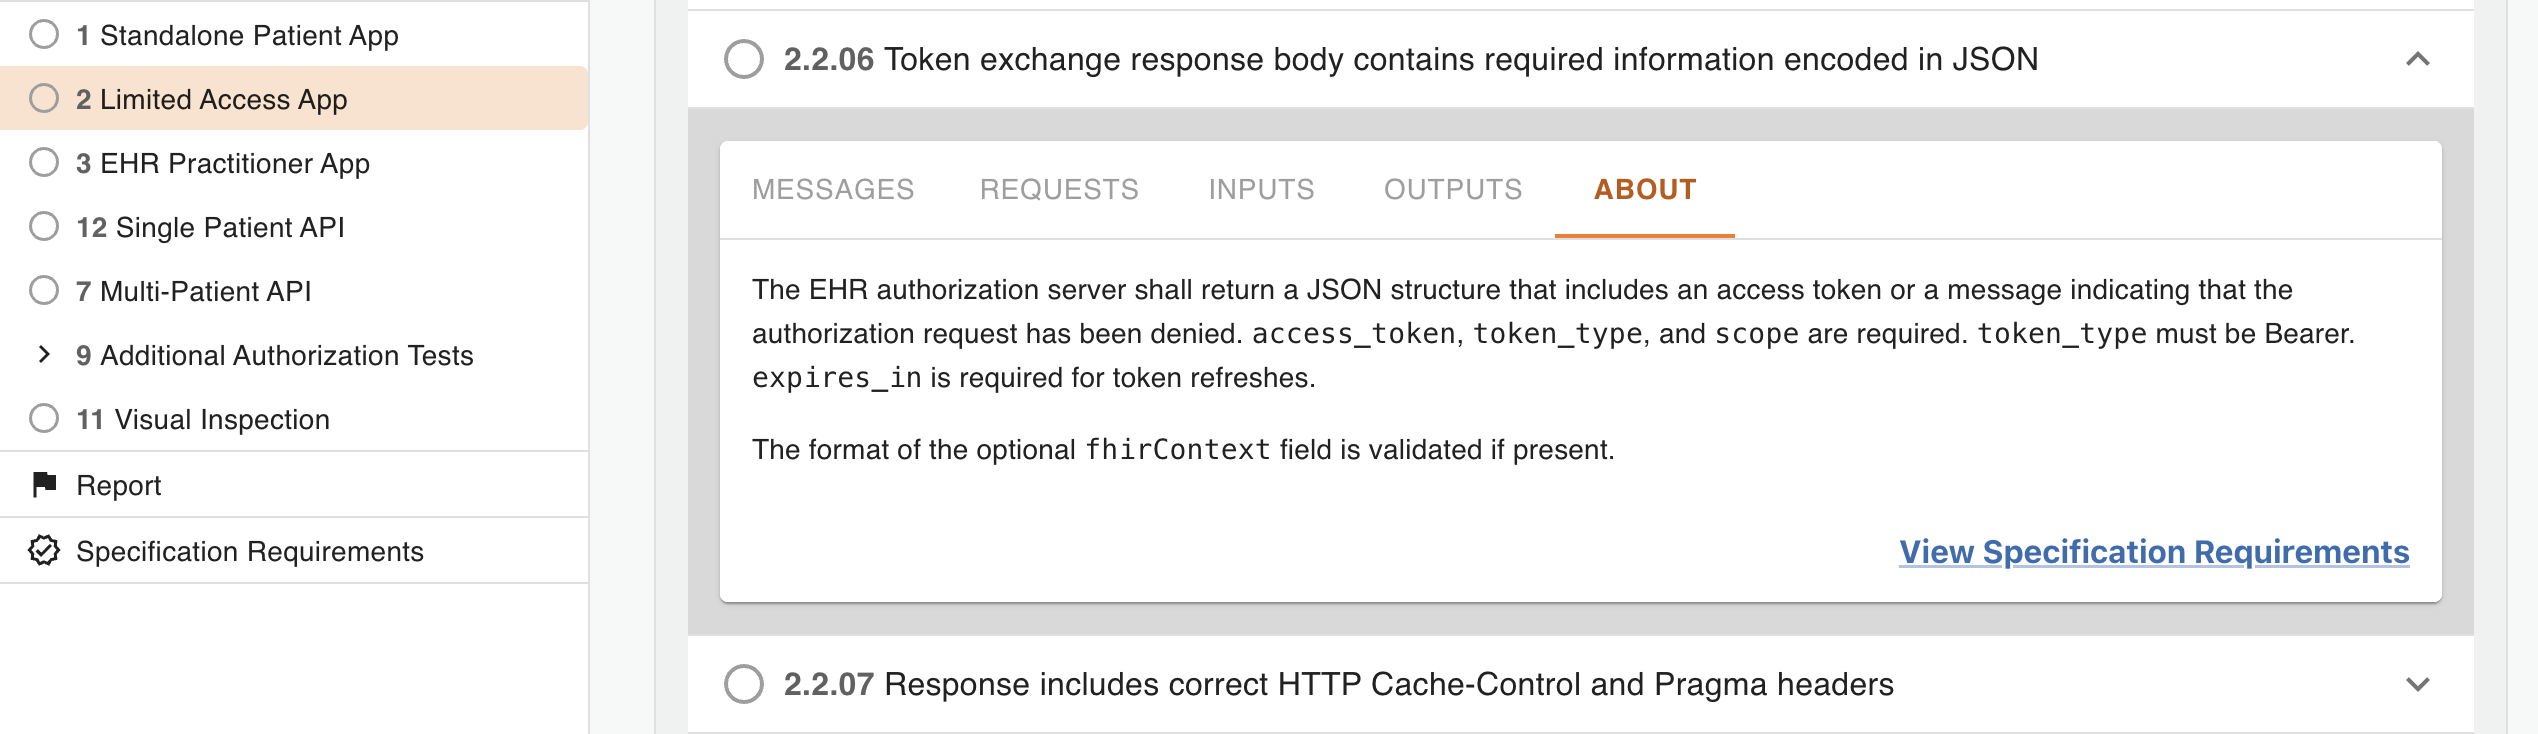
Suites, test groups, and tests that the test kit developers marked as verifying specific requirements will include a “View Specification Requirements” link at the bottom right of their documentation panel.
Clicking on this link will bring up a display of the requirements completely or partially verified when the tested system has passed the test.
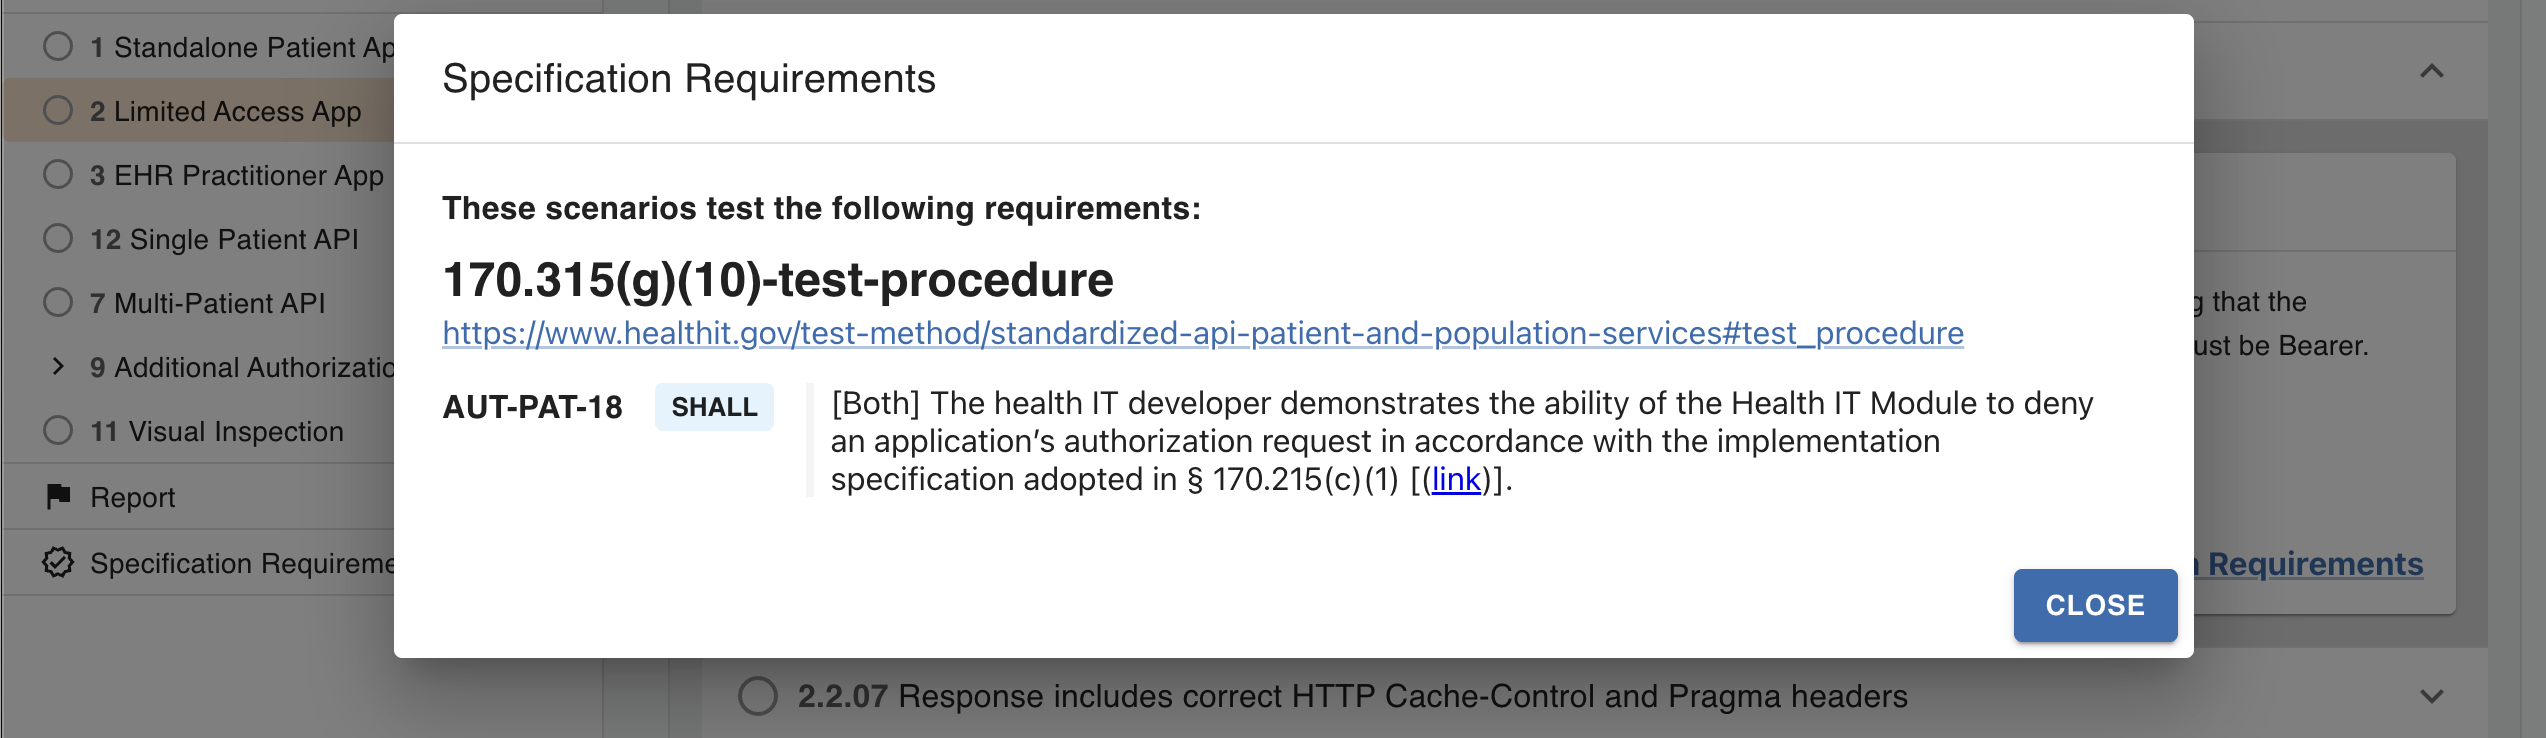
This display is similar to the “Specification Requirements” page, but
- Includes only requirements verified by the selected test, group, or suite.
- Does not include the list of all tests that verify the requirement.
- Does not support filtering.
Note that
- A passing test does not necessarily indicate conformance to all associated requirements. If the requirement is associated with multiple tests, the verification performed by each test may be partial.
- Other requirements may be verified by child tests or test groups. Verified requirements do not roll up into the parent’s list of verified requirements because a passing parent does not always imply a passing child (e.g., in the case of an optional child test).
Suggest an improvement
Want to make an change? Contribute an edit for this page on the Inferno Framework GitHub repository.